Tucson Real Estate News

Oct. 9, 2025

Why October Is the Best Time To Buy a Home in 2025

Why October Is the Best Time To Buy a Home in 2025


If you’ve been watching from the sidelines, now’s the time to lean in. It’s officially the best time to buy this year. According to Realtor.com, this October will have the most buyer-friendly conditions of any month in 2025:

“By mid-October, buyers across much of the country may finally find the combination of inventory, pricing, and negotiating power they’ve been waiting for—a rare opportunity in a market that has been tight for most of the past decade.”

So, if you’re ready and able to buy right now, shooting for this month means you should see:

  • More homes to choose from
  • Less competition from other buyers
  • More time to browse
  • Better home prices
  • Sellers who are more willing to negotiate

Just remember, every market is different. For most of the top 50 largest metros, that sweet spot falls in October. But the peak time to buy may be slightly earlier or later, depending on where you live. As Realtor.com explains:

“While Oct. 12–18 is the national “Best Week,” timing can shift depending on the local markets. . .”

Best Week To Buy for the Top 50 Largest Metro Areas

  • Atlanta-Sandy Springs-Roswell, GA: September 28 – October 4
  • Austin-Round Rock-San Marcos, TX: September 28 – October 4
  • Baltimore-Columbia-Towson, MD: October 12 – 18
  • Birmingham, AL: October 19 – 25
  • Boston-Cambridge-Newton, MA-NH: October 26 – November 1
  • Buffalo-Cheektowaga, NY: October 12 – 18
  • Charlotte-Concord-Gastonia, NC-SC: November 2 – 8
  • Chicago-Naperville-Elgin, IL-IN: September 28 – October 4
  • Cincinnati, OH-KY-IN: October 12 – 18
  • Cleveland, OH: October 12 – 18
  • Columbus, OH: October 12 – 18
  • Dallas-Fort Worth-Arlington, TX: September 28 – October 4
  • Denver-Aurora-Centennial, CO: October 12 – 18
  • Detroit-Warren-Dearborn, MI: October 12 – 18
  • Grand Rapids-Wyoming-Kentwood, MI: September 28 – October 4
  • Hartford-West Hartford-East Hartford, CT: September 21 – 27
  • Houston-Pasadena-The Woodlands, TX: October 12 – 18
  • Indianapolis-Carmel-Greenwood, IN: October 26 – November 1
  • Jacksonville, FL: October 26 – November 1
  • Kansas City, MO-KS: October 12 – 18
  • Las Vegas-Henderson-North Las Vegas, NV: October 5 – 11
  • Los Angeles-Long Beach-Anaheim, CA: October 12 – 18
  • Louisville/Jefferson County, KY-IN: November 2 – 8
  • Memphis, TN-MS-AR: September 21 – 27
  • Miami-Fort Lauderdale-West Palm Beach, FL: November 30 – December 6
  • Milwaukee-Waukesha, WI: September 7 – 13
  • Minneapolis-St. Paul-Bloomington, MN-WI: October 26 – November 1
  • Nashville-Davidson--Murfreesboro--Franklin, TN: October 12 – 18
  • New York-Newark-Jersey City, NY-NJ: September 14 – 20
  • Oklahoma City, OK: October 12 – 18
  • Orlando-Kissimmee-Sanford, FL: October 26 – November 1
  • Philadelphia-Camden-Wilmington, PA-NJ-DE-MD: September 7 – 13
  • Phoenix-Mesa-Chandler, AZ: November 2 – 8
  • Pittsburgh, PA: October 12 – 18
  • Portland-Vancouver-Hillsboro, OR-WA: October 26 – November 1
  • Providence-Warwick, RI-MA: October 19 – 25
  • Raleigh-Cary, NC: October 12 – 18
  • Richmond, VA: October 26 – November 1
  • Riverside-San Bernardino-Ontario, CA: September 28 – October 4
  • Sacramento-Roseville-Folsom, CA: October 12 – 18
  • San Antonio-New Braunfels, TX: October 12 – 18
  • San Diego-Chula Vista-Carlsbad, CA: October 12 – 18
  • San Francisco-Oakland-Fremont, CA: October 12 – 18
  • San Jose-Sunnyvale-Santa Clara, CA: October 19 – 25
  • Seattle-Tacoma-Bellevue, WA: October 19 – 25
  • St. Louis, MO-IL: October 12 – 18
  • Tampa-St. Petersburg-Clearwater, FL: November 30 – December 6
  • Tucson, AZ: October 12 – 18
  • Virginia Beach-Chesapeake-Norfolk, VA-NC: September 21 – 27
  • Washington-Arlington-Alexandria, DC-VA-MD-WV: October 12 – 18

What the Experts Are Saying

And Realtor.com isn’t the only one saying you’ve got an opportunity if you move now. Lawrence Yun, Chief Economist at the National Association of Realtors (NAR), explains:

Homebuyers are in the best position in more than five years to find the right home and negotiate for a better price. Current inventory is at its highest since May 2020, during the COVID lockdown.”

Daryl Fairweather, Chief Economist at Redfin, puts it like this:

Nationally, now is a good time to buy, if you can afford it . . . with falling mortgage rates and significantly more inventory, buyers have an upper hand in negotiations.”

And NerdWallet says:

“This fall just might be the best window for home buyers in the past five years.”

How To Get Ready for this Golden Window

To make sure you’re ready to jump in whenever your market’s best time to buy arrives, talk to a local agent now. They’ll be able to give you more information on your market's peak time, why it’s good for you, and the steps you’ll need to take to get ready.

Bottom Line

If you're serious about buying, getting prepped for this October window is a smart play.

Want help lining up your strategy? Let's have a quick conversation so you've got the information you need to be ready for this prime buying time.

Aug. 16, 2025

Online Home-Buying Searches Just Hit a 2-Year High—Here’s What That Means for Sellers

Online Home-Buying Search Terms Recently Hit 2-Year High


Believe it or not, there are clear signs buyer interest is heating up again.

Let’s talk about what’s really going on behind the scenes, and why the housing market might not be as quiet out there as it seems. 

Buyers Are Looking, and Search Trends Prove It

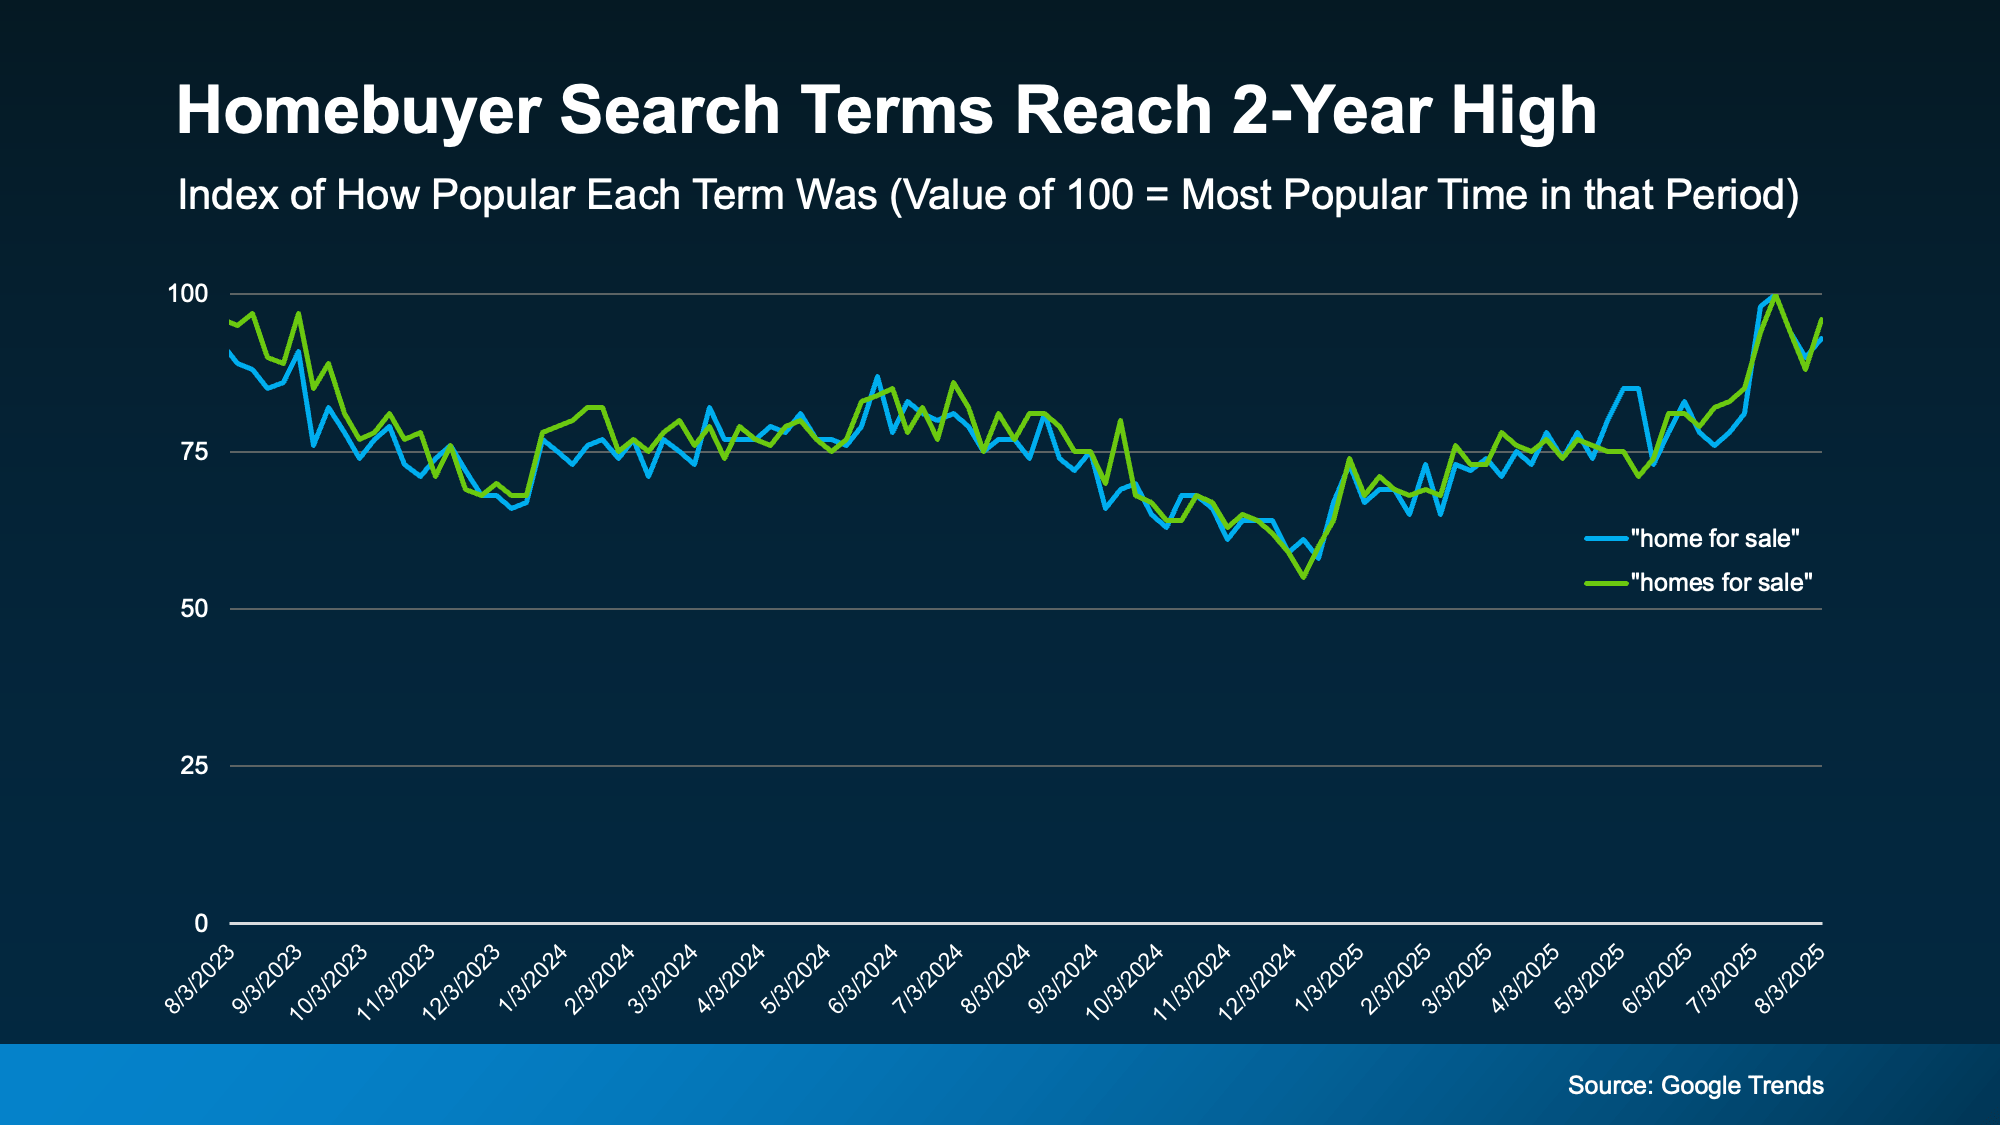
One of the clearest ways to measure what people are thinking about is to look at what they’re searching for online. And according to Google Trends, searches for phrases like “home for sale” have been climbing steadily this year.

The graph below shows an index of two common homebuyer search phrases and how popular they were on Google over the past two years. The higher the line goes, the more popular that phrase was. A 100 on the graph shows the most popular time for each phrase:

a graph of a number of peopleHere’s what really stands out in this data. Both phrases have been trending up overall this year, and they hit a recent high in mid-July. That’s a pretty strong sign that curiosity (and maybe even interest) in buying a home is improving.

That kind of momentum means something. Despite high mortgage rates and home prices, buyers haven’t given up. They're still watching the market. They’re still browsing. And many are just waiting for the right opportunity to act. Maybe your house is exactly what they’re looking for. But you’ll never know if it’s not listed yet.

Now, this doesn’t mean demand is going to surge like it did during the pandemic. It just means some buyers are deciding they can’t wait any longer. And those are exactly the kind of buyers you want. Motivated. Eager. Ready to move when the right house comes along.

So, if you’re holding off on selling because you’re not sure if the demand is there, this data suggests it might be time to rethink your plans. Because while it’s not 2021-level demand, it doesn’t need to be. You don’t need ten offers to sell your home. You just need the right buyer.

And that buyer may be searching for a house like yours right now.

Bottom Line

If you’ve been thinking, “I’ll sell once buyers come back,” you might want to take another look. Online search trends show they’re already interested.

What would make you feel confident putting your house on the market this year? Let’s connect to talk through it.

Aug. 14, 2025

July 2025 Tucson Real Estate Market Report: Trends, Insights & Local Impact

🏡 July 2025 Tucson Real Estate Market Report: Inventory Climbs, Prices Adjust, Opportunity Emerges

As Tucson’s summer heat peaks, so does a shift in the housing landscape. July 2025 brought a noticeable uptick in inventory, a softening in prices, and subtle shifts in buyer behavior across the Metro Tucson market. Whether you're buying, selling, or simply staying informed, this month’s data offers a clear signal: the market is recalibrating

📊 Key Highlights from July 2025

  • Active Inventory: 4,464 homes on the market — a 31% increase from July 2024
  • Closings: 1,209 homes sold — down 2% year-over-year
  • Median Sold Price: $386,460 — a 4% drop from July 2024
  • Months of Inventory: 3.7 — up from 2.8 last July, indicating a shift toward balance
  • New Contracts: 1,285 properties went under contract — down 1% from July 2024
  • Year-to-Date Closings: 8,917 — virtually unchanged from 2024

“We’re seeing more homes hit the market and sellers adjusting expectations. That’s creating room for negotiation and opportunity—especially for buyers who’ve been waiting for a window.” — Steve Redmond, Long Realty

🏘️ Neighborhood & Price Band Insights

The market remains highly localized. Here’s how different price ranges are performing:

Price Range

Market Condition

Months of Inventory

$200K–$299K

Strong Seller Market

2.2–2.6

$300K–$399K

Seller Market

3.1–3.7

$400K–$599K

Seller Market

3.7–3.9

$600K–$899K

Slight Seller Market

4.0–4.6

$900K+

Balanced Market

4.7–5.6


📍 Zip codes like 85739, 85742, and 85718 saw price increases, while others like 85706 and 85730 experienced declines. This underscores the importance of hyper-local strategy when buying or selling.


🌵 Tucson Trends to Watch

  • Affordability Pressure: Monthly payments on a median-priced home now average $2,469.82, up from $2,456.18 in 2024
  • New Construction: Permits are down 38% year-over-year, while closings are up 9% — signaling demand outpacing new supply
  • DEI & Community Impact: More agents are adopting inclusive language and culturally aware outreach, especially in historically underserved areas
  • Sustainability Sells: Homes with solar, xeriscaping, and energy-efficient upgrades continue to attract faster offer


Tucson’s housing market isn’t just about numbers

It’s about neighborhoods, legacy, and belonging. July’s trends reflect a community in motion, balancing growth with authenticity. Whether you're navigating a first purchase or planning a strategic sale, let’s keep the conversation rooted in what makes Tucson home.


📲 Ready to Dive Deeper?🧭 Local Lens: Why It Matters

Explore listings, get matched with a local expert, or download the full July Market Snapshot.


Posted in Market Updates
July 31, 2017

Curious About Local Real Estate?

Receive the Latest Local Market Stats

Curious about local real estate? So are we! Every month we review trends in our real estate market and consider the number of homes on the market in each price tier, the amount of time particular homes have been listed for sale, specific neighborhood trends, the median price and square footage of each home sold and so much more. We’d love to invite you to do the same!

Get Local Market Reports Sent Directly to You

You can sign up here to receive your own market report, delivered as often as you like! It contains current information on pending, active and just sold properties so you can see actual homes in your neighborhood. You can review your area on a larger scale, as well, by refining your search to include properties across the city or county. As you notice price and size trends, please contact us for clarification or to have any questions answered.

We can definitely fill you in on details that are not listed on the report and help you determine the best home for you. If you are wondering if now is the time to sell, please try out our INSTANT home value tool. You’ll get an estimate on the value of your property in today’s market. Either way, we hope to hear from you soon as you get to know our neighborhoods and local real estate market better.

Posted in Market Updates